The Operating Room Was Designed Around the Monitors
An operating room is not designed and then fitted with monitors.
The monitors came first.
Surgeons told architects: we need to see heart rate without turning our head.
We need oxygen saturation in our peripheral vision.
We need the alarm to be audible from every position in the room.
The room was shaped around what needed to be seen.
Most engineering organizations do the opposite.
They design the system.
They build the system.
They deploy the system.
And then someone asks: how do we know it is working?
And a monitoring dashboard is bolted to the side of something that was never designed to be watched.
The Wrong Order
The usual sequence looks like this:
- Architect the system
- Build the system
- Deploy the system
- Add logging
- Add metrics
- Add tracing
- Wonder why nothing connects
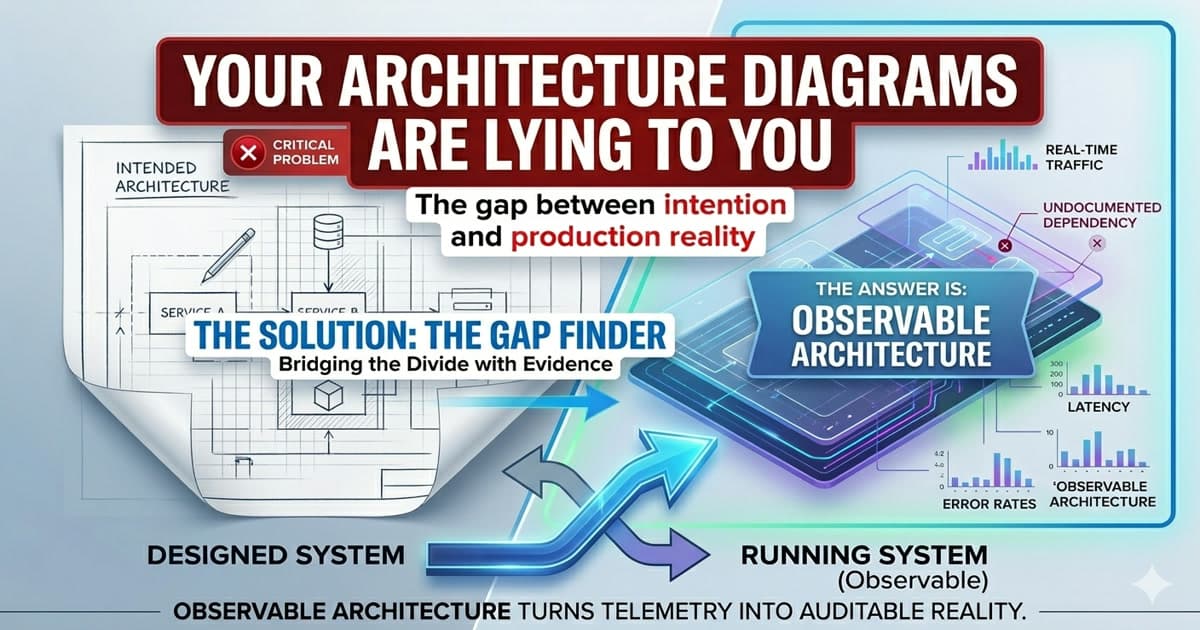
This is not observability.
This is archaeology.
You are excavating a system you built without instruments, hoping to find meaning in the rubble of logs that were never designed to tell a coherent story.
Why Observability Fails at the Architecture Stage
Most observability failures are not monitoring failures.
They are architecture failures.
1. Observability Is Treated as Infrastructure, Not Design
A team adds Prometheus.
Another team adds Datadog.
A third team adds custom logging middleware.
Nobody agreed on what a signal should mean.
Nobody agreed on what a trace boundary is.
Nobody agreed on which events are worth emitting.
The tools exist.
The signal is noise.
2. Services Are Built to Function, Not to Be Understood
A microservice processes a payment.
It succeeds or it fails.
But nobody asked at design time:
What does a slow success look like?
What does a partial failure look like?
What does degraded-but-functional look like?
If you did not design the signal, the system cannot emit it.
3. Teams Own Metrics but Nobody Owns Meaning
One team tracks latency.
Another team tracks error rate.
A third team tracks queue depth.
Nobody has connected these into a coherent picture of system health.
Observability without a shared signal model is a collection of numbers with no sentence to put them in.
Observability Signal Architecture Framework (OSAF)
Observability Signal Architecture Framework (OSAF) is a five-pillar model for embedding observability into architectural decisions — not as an afterthought, but as a first-class design constraint.
Its purpose is direct:
Make the system legible before it goes to production, not after it breaks.
%% caption: OSAF: the five design areas that make a system observable before it reaches production
flowchart TB
    A["Observability Signal Architecture Framework (OSAF)"]
    A --> B["Signal Design"]
    A --> C["Trace Boundary Definition"]
    A --> D["Feedback Loop Velocity"]
    A --> E["Alerting Fidelity"]
    A --> F["Observability Governance"]
The Five Pillars at a Glance
| Pillar | When Absent | When Present |
|---|---|---|
| Signal Design | Teams emit default logs. Signals are inconsistent across services. | Each service has a named signal contract. Dashboards exist before deployment. |
| Trace Boundary Definition | Traces are per-service. Debugging requires correlating five dashboards manually. | Boundaries are defined at design time. One trace ID tells the full business story. |
| Feedback Loop Velocity | Teams learn about degradation when customers complain. | Signals surface degradation before it becomes failure. Early warning is designed in. |
| Alerting Fidelity | Alert fatigue is endemic. Engineers mute notifications. Real failures hide in the noise. | Each alert has an owner, a threshold rationale, and a runbook link. |
| Observability Governance | Each team instruments differently. New services arrive with no signal contract. | Observability is a production gate. No service ships without a validated signal contract. |
Pillar 1: Signal Design
Before a line of code is written, the signals must be named.
What does normal look like for this service?
What does degraded look like?
What does silent failure look like — the case where the system appears healthy but is not delivering value?
Signal Design answers these questions at architecture time, not incident time.
Absent: Teams emit whatever logging their framework provides by default. Signals are inconsistent across services.
Present: Each service has a named signal contract. Events are typed. Severities are pre-agreed. Dashboards are designed before deployment.
Pillar 2: Trace Boundary Definition
A distributed system without agreed trace boundaries is a mystery box.
A request enters.
Something happens across six services.
A response exits.
And when it goes wrong, nobody knows where to look.
Trace Boundary Definition answers one question: where does the business transaction begin and where does it end?
Not the technical call chain.
The unit of business value. A payment. An onboarding step. A document generation.
Absent: Traces are instrumented per service but never stitched into a business-meaningful unit. Debugging requires manually correlating logs across five dashboards.
Present: Trace boundaries are defined at architecture design time. Every service knows which trace context to propagate. A single trace ID tells the full story.
Pillar 3: Feedback Loop Velocity
An architecture that takes 45 minutes to surface a signal is not observable.
It is delayed.
Feedback Loop Velocity measures how quickly the system tells you something has changed — not just that it broke, but that it is slowing, drifting, or approaching a threshold.
Absent: Teams find out about degradation when customers complain.
Present: Signals surface degradation before it becomes failure. The architecture was designed to emit early warning, not just final status.
Pillar 4: Alerting Fidelity
An alert that fires every day at 2am and is acknowledged and closed is not an alert.
It is noise.
Alerting Fidelity measures the ratio of actionable signals to total signal volume.
A high-fidelity alert tells you exactly what happened, which system boundary was crossed, and what the correct first response is.
A low-fidelity alert tells you something is wrong and leaves the rest to the on-call engineer at 2am.
Absent: Alert fatigue is endemic. Engineers mute notifications. Real failures hide in the noise.
Present: Alerts are designed at the architecture layer. Each alert has an owner, a threshold rationale, and a runbook link. Alert volume is treated as an architectural health metric.
Pillar 5: Observability Governance
Observability standards that exist only in a wiki are not standards.
They are suggestions.
Observability Governance measures whether the standards are enforced at the point where architecture decisions are made — not after systems go live.
Absent: Each team instruments their services differently. A new service joins the platform with no signal contract and a custom logging format.
Present: Observability requirements are part of the architecture review checklist. A service cannot graduate to production without a defined signal contract, a trace boundary, and a validated dashboard.
The Design Decision That OSAF Changes
The moment OSAF changes is the architecture design session.
Not the incident review.
Not the post-mortem.
The session where a team decides how a service will behave.
%% caption: Without OSAF, monitoring is added after deployment as an afterthought
flowchart LR
    A["Design Session\n(Without OSAF)"] --> B["Functional Requirements"]
    B --> C["Non-Functional Requirements"]
    C --> D["Build"]
    D --> E["Deploy"]
    E --> F["Add Monitoring\n(Afterthought)"]
%% caption: With OSAF, signal contracts and trace boundaries are agreed at design, so the service deploys observable
flowchart LR
    A["Design Session\n(With OSAF)"] --> B["Functional Requirements"]
    B --> C["Signal Contract\nDefined"]
    C --> D["Trace Boundary\nAgreed"]
    D --> E["Build"]
    E --> F["Deploy\n(Already Observable)"]
The difference is not in the tools used.
It is in the order of decisions.
What Breaks Without OSAF
Silent Degradation Becomes the Default
A service runs.
Latency increases by 40 milliseconds per week.
Nobody notices.
No threshold is crossed.
No alert fires.
Six months later, a downstream system times out and a customer-facing feature goes dark.
The root cause is a degradation curve that started six months ago.
Nobody saw it because nobody designed a signal to surface it.
Incidents Become Archaeology Expeditions
A production failure occurs at 11pm.
The on-call engineer opens five dashboards.
They correlate log timestamps manually.
They search for the trace ID in three different tools.
Forty minutes later, they have a hypothesis.
Ninety minutes later, they have a fix.
The system was not built to be understood.
It was built to function.
Understanding was left to the engineer at 11pm with five browser tabs open.
Platform Changes Become Dangerous
A shared platform team upgrades a library.
Downstream teams have no signal that their latency profile changed.
The change ships.
Three weeks later, a degradation surfaces.
Nobody can connect the library upgrade to the latency increase.
The correlation was not preserved.
Because the signal was never designed to carry it.
Implementation Guide (30–60 Days)
Phase 1: Map the Signal Debt (Weeks 1–2)
Walk through your five most critical services.
For each one, ask:
- What does a slow success look like? Can we detect it today?
- What does a partial failure look like? Does a signal exist for it?
- What is the trace boundary for the primary business transaction this service participates in?
Do not fix anything yet.
Document the gap between what the system can tell you and what you need to know.
Deliverable: Signal Debt Map for the top five services
Success Metric: At least three signals identified as missing, ambiguous, or unmeasurable
Phase 2: Define a Signal Contract Standard (Weeks 3–4)
Draft a Signal Contract template.
One page.
Every service must define before deployment:
- The primary business event this service emits
- The normal range for latency, error rate, and throughput
- The trace context fields it propagates
- The alert conditions and their severity
- The runbook owner
Make this template part of your architecture review process.
Deliverable: Signal Contract Template v1
Success Metric: The template reviewed and approved by the architecture review board
Phase 3: Retrofit One Service, Then Standardize (Weeks 5–8)
Choose one critical service with the highest signal debt.
Apply the Signal Contract.
Redesign the signals. Redefine the trace boundary. Raise the alert fidelity.
Measure the before and after: how long did the last incident take to diagnose before? How long would it take now?
Use the evidence to mandate the Signal Contract for all new services going forward.
Deliverable: One retrofitted service with a complete Signal Contract
Success Metric: Incident diagnosis time reduced by at least 40 percent for that service
Evidence from Practice
An e-commerce company I worked with had monitoring on every service — dashboards, alerts, pager duty rotations — and still could not explain why checkout latency spiked every Sunday. The on-call engineer spent the first two hours of every incident correlating dashboards across five tools before they could even identify which service was responsible.
We introduced signal contracts — a specification of what each service must emit to make the system legible. Each contract was defined during architecture design, not after deployment. The Sunday spikes turned out to be a batch job sharing a database connection pool with checkout — invisible in the monitoring, obvious in the signal contract. Within 30 days, mean time to diagnosis dropped by 60%.
Action Plan
This Week
Ask three questions:
- Pick any service that had a production incident in the last 90 days. How long did it take to identify the root cause? Was the signal that revealed the cause designed into the system — or discovered by accident?
- Can you draw the trace boundary for your most important customer-facing transaction today? Not the service boundary. The business transaction boundary.
- Look at your alert volume over the last 30 days. What percentage of those alerts required a human to take a meaningful action? If the answer is under 30 percent, you have an alerting fidelity problem.
If the answers require opening five tools and asking three people, you do not have observability.
You have instrumentation without intent.
Next 30 Days
- Conduct a Signal Debt Map across your five most critical services
- Draft a Signal Contract template and run it through architecture review
- Identify one high-debt service to retrofit as a proof of concept
3–6 Months
- Mandate Signal Contracts as a gate in your architecture review process
- Embed trace boundary definition into your system design template
- Measure alert fidelity monthly and treat it as an architectural health metric
- Report incident diagnosis time as a design quality metric alongside delivery velocity
Final Thought
The operating room was not an accident.
Every monitor was placed with intent.
Every alarm threshold was agreed before the first surgery.
The room was designed to make the invisible visible.
Your architecture has the same obligation.
Not to function.
To be understood.
Build the signal before you build the system.
Turn Observability From an Afterthought Into an Architectural Constraint
If your teams are still retrofitting monitoring onto systems that were never designed to be watched…
if your on-call engineers spend more time correlating dashboards than resolving incidents…
or if your architecture reviews discuss functionality but never discuss what the system will tell you when something goes wrong —
then the problem is not the tooling.
It is the sequence.
Observability is being designed last.
It needs to be designed first.
In a focused 30-minute Architecture Observability Diagnostic, we will:
- Map the Signal Debt across your most critical services
- Identify which OSAF pillar is your primary blind spot
- Define the Signal Contract standard your team can adopt in 30 days
- Build observability checkpoints into your existing architecture review process
No tool evaluations.
No dashboard theater.
No generic "shift left on monitoring" advice.
Just a clear picture of where your architecture is blind.
And a concrete path to making it legible.
→ Book an Observability Architecture Diagnostic
or
The surgeon did not guess.
They read the monitor.
Because someone designed the room that way.